Who was 2020’s most valuable target, part II?
Wherein Christian makes a formula and declares Rashard Higgins king of the universe.
On Wednesday, I dug into which wideouts and tight ends provided the most extra value to their quarterbacks. This wasn’t an especially complex idea; it effectively boiled down to the difference between a player’s passer rating when targeted vs. his quarterback’s season-long passer rating.
It also found Tyler Higbee was the league’s most valuable WR/TE when it came to making his quarterback look better. So for the past two days, I’ve been working to refine it. To create a new formula that better takes into account the degree of difficulty from a QB’s throws downfield and how reliable his top guys really are. What followed was a 1,700 cell spreadsheet, roughly a dozen scrapped formulas, and a working solution that declared 2020’s true target king.
That’s right, the guy in that picture.
On the right.
Cleveland Brown Rashard Higgins.
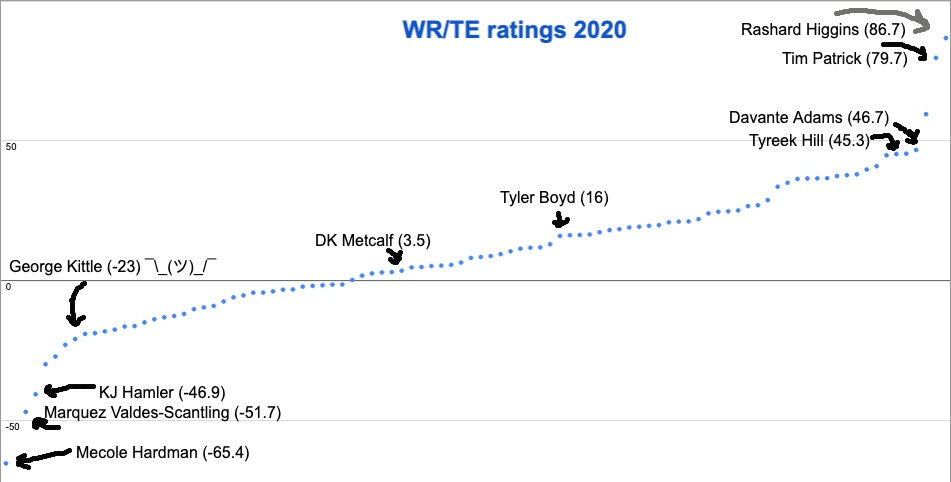
The formula needs some tweaking -- George Kittle probably *isn’t* a bottom 10th percentile target -- but here’s how it boiled down. I took the value added rating numbers from Wednesday’s newsletter and balanced that against a player’s average target distance to get a better idea of how “safe” a typical play was for each WR/TE. I also added the third-most efficient WR/TE from each roster (min. 50 targets, with a few exceptions) to create a range of 96 players for this chart.
A player’s average target distance was compared against the sample average, then divided by 10. This created a bonus multiplier that either added points to a player’s passer rating (when his target depth was greater than the 9.9 yard NFL average) or lowered it (when his depth was less than 9.9). This rewarded players who ran deeper routes for the implied increase in difficulty of these plays. That number gave me an adjusted passer rating for step two.
Next, I found each player’s drop rate (per Pro Football Reference) and compared that to the sample-wide average and expressed that as a function of the standard deviation among those numbers. That ratio was divided by five to create our second multiplier that would lead us to a deeper look into a player’s value. Why not 10, like before? Because the target depth multiplier already had a crack at the unadjusted rating figure, which gave it a larger impact in the final number, and because drops play a more significant role in derailing an offense than a short route.
The end result was a formula that weighs a player’s passer rating against his quarterback’s, then adjusts that number based on how deep he was when targeted and how often he dropped the ball. Here’s what those numbers look like. Click to enlarge:
The upper crust is dotted with players you’d expect; Davante Adams, Tyreek Hill, Travis Kelce, Mike Evans, and Justin Jefferson all cemented their status as top 10 guys under this metric. The real surprises near the top are Higgins (boosted by a deep target distance and zero drops in a relatively small 52-target sample size), Robert Tonyan (still thriving from an unsustainable touchdown rate but helped by zero drops), and Travis Fulgham (a bright spot in a sea of bad quarterbacking in Philly).
The bottom third has more questionable results. D.J. Moore’s number is garbage because Carolina’s QBs threw nine of their 16 interceptions in his direction, but he also dropped more passes than the average WR. Kittle was roasted by a low target distance (thanks, Jimmy Garoppolo!) and a drop rate that was more than double his previous career worst. AJ Green, uh, was generally pretty bad on the field but not helped by a lack of connection with rookie quarterback Joe Burrow. His adjusted rating number of -16.3 was significantly higher than the -30.6 rating-when-targeted mark he actually posted in his final year as a Bengal.
It’s been a long time since my statistics days in graduate school, so be aware these numbers are completely observational. They haven’t been run in a regression analysis that would correlate the effect of route depth and drop rate on a receiver’s output. They’re simply an index of which players have been the most reliable in tough situations, running more rewarding routes and dropping the ball less than their peers.
The formula likely overvalued strong hands. Big play savants like Marquez Valdes-Scantling, Mecole Hardman, and Moore both earned boosts for their deep average target depths, then had those gains wiped out by high drop rates as they sank to the bottom of the 96-player sample. If MVS, for example, had three drops last season instead of seven, his adjusted score would have risen from -51.7 to 19.8 -- a rise from 95th to 31st. Next time around I’ll limit that skew while also accounting for what a quarterback’s numbers would be without any drops to get a better idea of his ideal rating and how damaging bad hands can be.
You know, bad hands like this:
So there’s still room for improvement, but I decided to take you along for the ride through this boring wonderland of statistics and rate data, possibly out of spite. Great wideouts and tight ends make big plays downfield with reliable hands to bail out their quarterbacks, but there’s still value in guys who can provide stable mid-range targets even if they drop a few passes.
Hopefully this was as interesting for you guys as it was for me, though I’m reasonably certain it wasn’t. Still, if you’re looking for a BCS-style metric to measure receiver value -- flaws and all -- this is a decent place to start. I’ll work on refining this and adding more data to get a better handle on who truly elevated his quarterback the highest in 2020.
Until then, all hail our wideout overlord Rashard Higgins. -- CD


